Published November 10, 2022
Bird spectrograms: A treasure trove of information
By Dr. Charles Clarkson
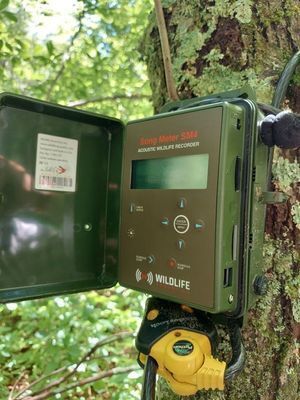
This week, I began what will likely be months of combing through the recordings from the Acoustic Recording Units (ARUs) that were deployed across six of our refuges this past spring and summer. The units each recorded the soundscape where they were positioned from 1 April until 1 August and, during that time, they gathered data on bird species that utilized our refuge habitats during spring migration and for breeding. Each recorder was programmed to begin recording at 4am and end recording at 9pm, with recording occurring in 30-minute on/30-minute off cycles. The ARUs collected over 20,000 hours of sound data during this period, which represents a treasure trove of information waiting to be discovered.
The task of going through this enormous amount of data is daunting and will be aided by two useful time-saving strategies. First, the newest analysis software used to process the sound recordings made by the ARUs is capable of scanning lengthy recordings and clustering all vocal signatures into groups based on similarity of frequency characteristics and duration. This aids our analysis by grouping all similar vocalizations, allowing for faster processing. For example, after uploading a single 24-hour period of recordings to the computer, the software identified 32,873 unique vocal signatures and grouped them into 145 clusters based on similarity. This does not mean that 145 individual species were detected. If a single species has more than one vocalization (all birds do), then EACH vocalization type would be clustered. In the example below, a return of over 1,000 “Peter, Peter, Peter” Tufted Titmouse (Baeolophus bicolor) whistle songs were clustered and an additional 1,000 downward slurred “Peew, Peew” calls from the same species were recorded.
-

Tufted Titmouse "Peter, Peter, Peter, Peter, Peter" song (click image to enlarge.)
-
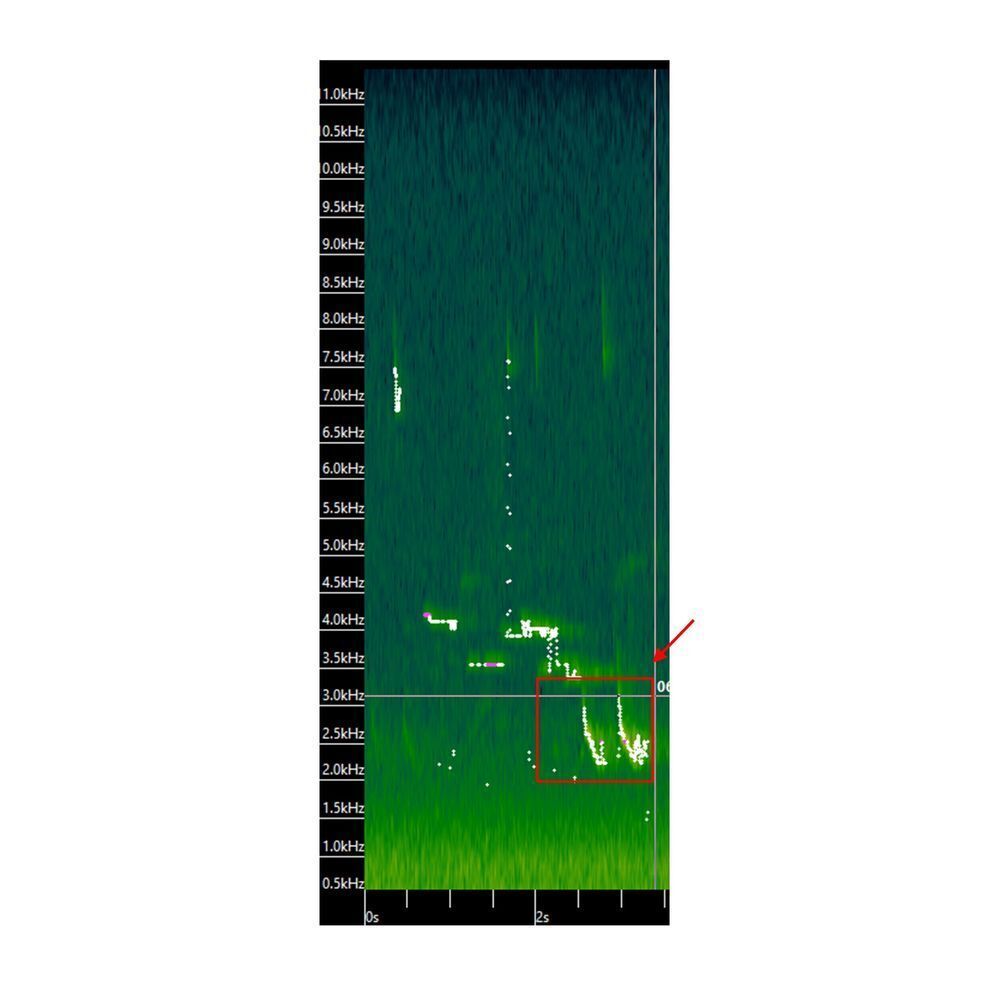
Tufted Titmouse "Peew, Peew" call (click image to enlarge.)
So, while the computer software aids analysis by grouping all similar vocalizations, it is still necessary to go through each cluster to confirm species identity and whittle the data down to the total number of species detected. This is where the second strategy employed during analysis will help tremendously. As the amount of time required to go through 20,000 hours of sound would be immense (remember, a single 24-hour period had over 32,000 vocal signatures), we will develop a random sampling approach to process the sound files. In essence, a certain number of hours of each 8.5-hour day of recordings will be chosen at random to analyze. Even just two hours of recordings each day would yield 122 hours of analyzed recordings for each ARU, or a total of 732 hours across all six refuges, still a very large amount of data.
Below are some spectrograms of species detected within the first day of analyzed recordings from our Cardi Swamp Wildlife Refuge. Enjoy!
Click each image to enlarge.