Published on December 14, 2022
How We Analyze Bird-Habitat Associations: Prevalence vs. Importance
Avian Research Initiative's Baseline Data Analysis
One of the most important pieces of information to come from our baseline data collection will be a comprehensive understanding of how birds associate with particular habitats on our wildlife refuges. This information is essential to our ability to: 1) manage the properties we currently conserve, and 2) prospect new properties in the future to maximize our conservation potential.
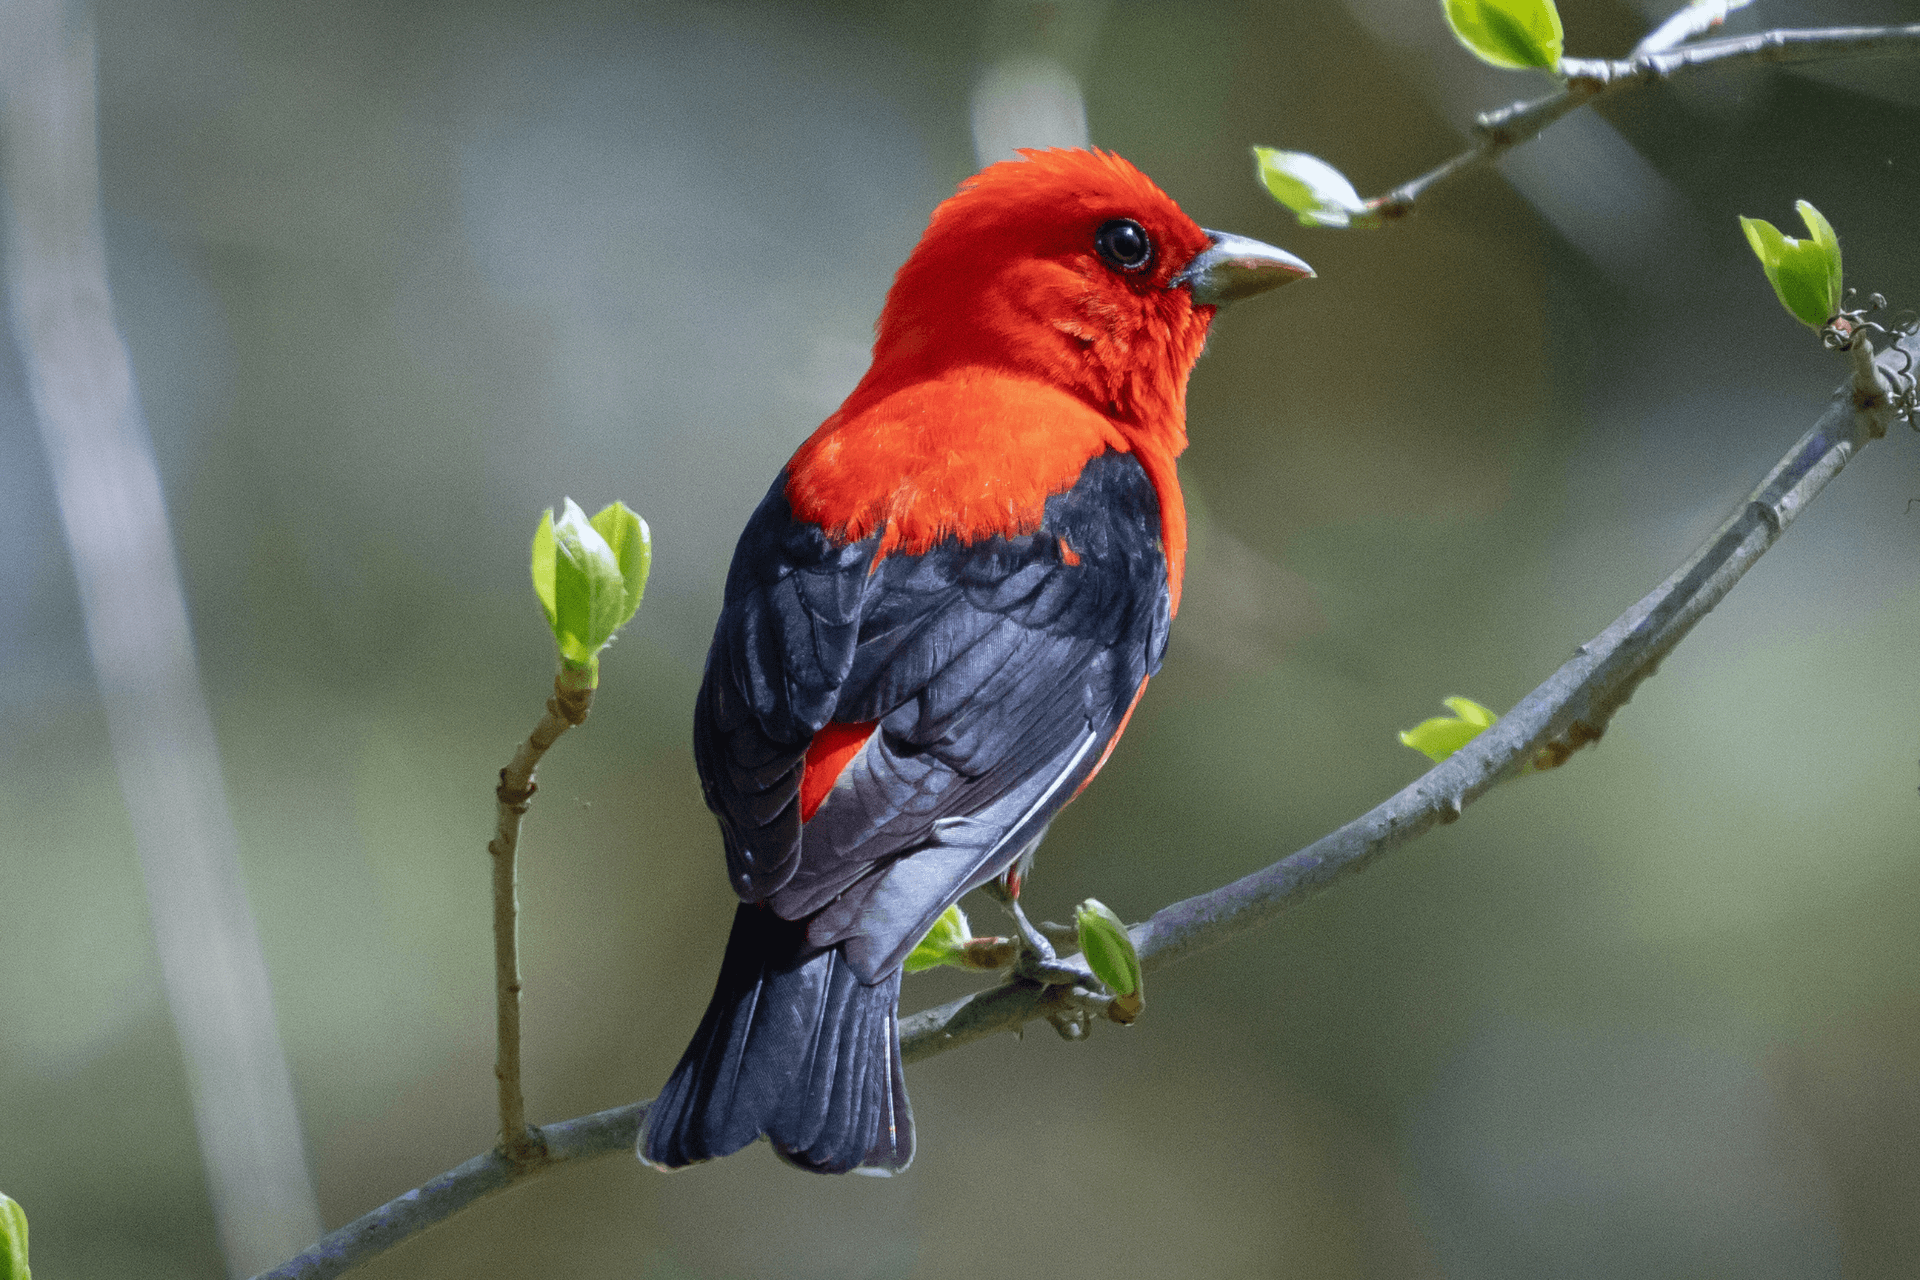
To illustrate just how important localized data on bird-habitat associations are, let us use the Carolina Wren (Thryothorus ludovicianus) as an example. The broad geographic range for this species occupies the eastern United States and stretches from southern New England to the Gulf Coast and west to Oklahoma. Carolina Wrens can even be found as permanent residents on the Yucatán peninsula of Mexico. According to the Cornell Lab of Ornithology’s “Birds of the World”, across this entire range, Carolina Wrens prefer a “Wide range of habitats, from brushy clearcuts…to hemlock and rhododendron choked ravines.” (Haggerty and Morton 2020). On a macro-scale, conservation of these habitat types may be an effective management strategy for the species within its native range, however, it bears mentioning that both hemlock and rhododendron only occur in isolated parts of the Carolina Wren’s range. Where then, should conservation attention be paid in areas where these plant species are absent? Obviously, more information is needed at smaller spatial scales to maximize conservation success.
Projects such as bird atlases help immensely with respect to focusing data collection to a smaller geographic extent. While the Carolina Wren can be found as a year-round resident in 30 U.S. states, the recently completed second Rhode Island Bird Atlas conducted detailed data collection within the state boundaries using data from over 3,000 point counts and thousands of hours of volunteer data collection. The Atlas documented the species in scrub/shrub, agricultural, residential, urban and forested wetland habitats (Figure 1).
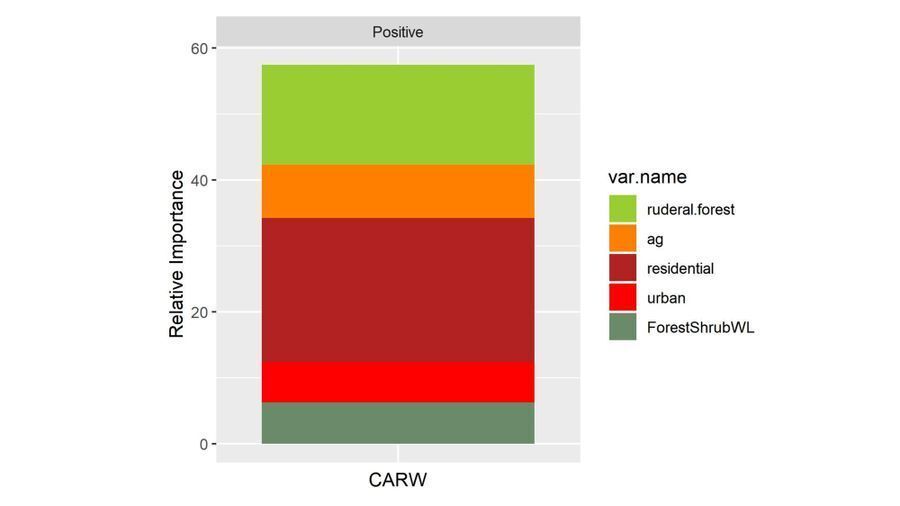
Figure 1: The recently completed second Rhode Island Bird Atlas documented positive relationships between Carolina Wren (Thryothorus ludovicianus) (CARW) occurrence and scrub/shrub (ruderal.forest), agricultural (ag), residential, urban and forested wetland (ForestShrubWL) habitats.
—
This information is far more useful for conservation work at smaller scales, as we now know that urban and residential habitat improvement projects in Rhode Island are likely to benefit the state’s Carolina Wren population. While this information greatly enhances the effectiveness of our conservation projects within our state, it does little to guide conservation and management at Audubon because it generalizes these relationships across all habitats within Rhode Island. As the Audubon Society of Rhode Island protects just 1.2% of all land in the state and our refuges do not contain urban and residential habitats, it becomes obvious that a more detailed understanding of Carolina Wren distribution specific to our nearly 9,500 acres is needed.
The results from the year-long baseline data collection scheme across Audubon’s 14 publicly accessible wildlife refuges has provided us with the detailed bird-habitat analysis we need to understand how birds distribute themselves on our parcels. Carolina Wrens breed across our refuges and, when they do, they are primarily using scrub/shrub, grassland/herbaceous, deciduous forest, mixed forest and open space habitats (Figure 2). While residential habitats are the most important for the species in the state as a whole, scrub/shrub habitats are the most important for Carolina Wrens breeding on our wildlife refuges. This level of localized analysis is essential to our ability to manage our properties for all bird species that use them.
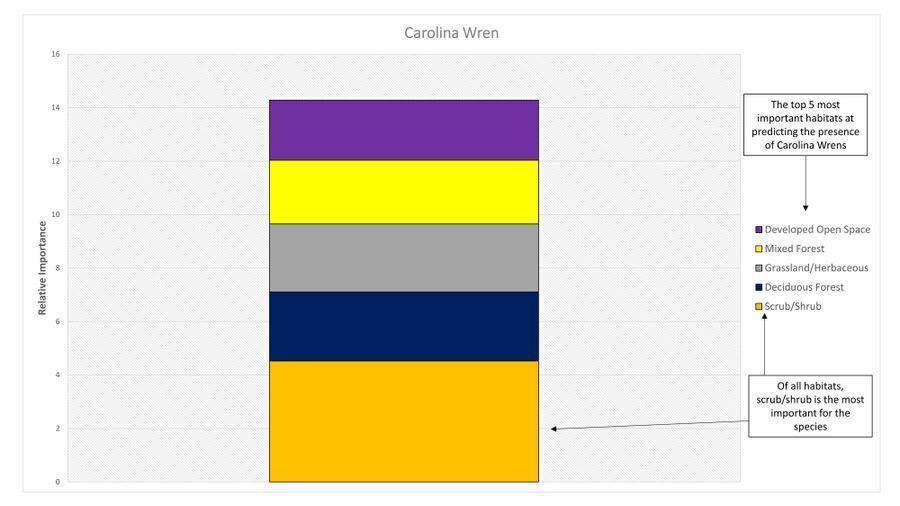
Figure 2: Analysis of bird-habitat associations from data collected across Audubon refuges shows that Carolina Wrens (Thryothorus ludovicianus) are most often associated with scrub/shrub, grassland/herbaceous, deciduous forest, mixed forest and open space habitats.
—
Over the past year, volunteers have scoured our 14 publicly accessible refuges to document the birdlife during breeding, nonbreeding and migratory seasons. Concurrent to these surveys, over 140 additional point count surveys were conducted at these same wildlife refuges. During each survey, every bird seen or heard was documented. Following fieldwork, computer-based mapping was used to determine both habitat prevalence at each survey point. A 100-meter diameter “neighborhood” was defined around each of these points and the proportion of every habitat type within each of these circles was calculated using a Geographic Information System (GIS; Figure 3).
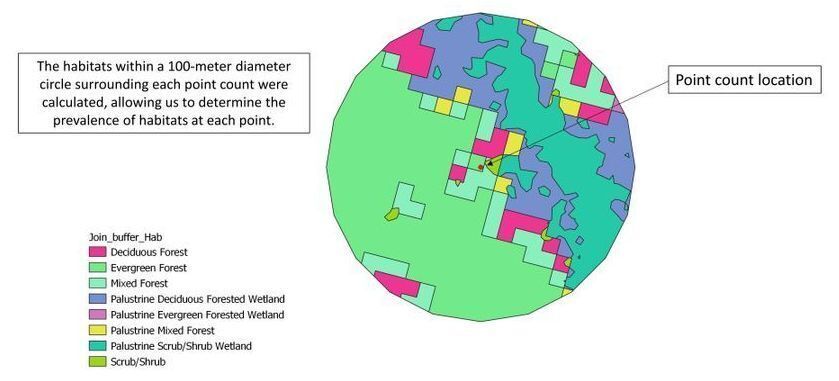
Figure 3: Around every point count station (red dot in middle of circle), all habitats within a 100-meter diameter circle were calculated to determine bird-habitat associations.
—
To determine bird-habitat associations, two data products were created that, when combined, teach us a great deal about how birds distribute themselves on our properties and how co-located habitats may impact their distribution.
First, the prevalence of each habitat type found within count circles tell us the most common habitats present at each point in which a particular species was detected. This allows us to determine the proportion of each habitat type that was sampled during our fieldwork and it gives an idea of habitat associations for many generalist species that might occupy a diversity of habitats. But, as most species tend to specialize in nesting habitats, an additional level of analysis is warranted.
Next, a computer ensemble learning method was employed to determine the relative importance of each habitat type for every species of bird detected. While relatively complicated to conduct, this statistical technique is critical to our ability to make informed management decisions. During this machine learning process, the habitats in count circles in which a given species was detected are compared to all habitats in all count circles and the relative importance of each of these habitats to a given species is determined.
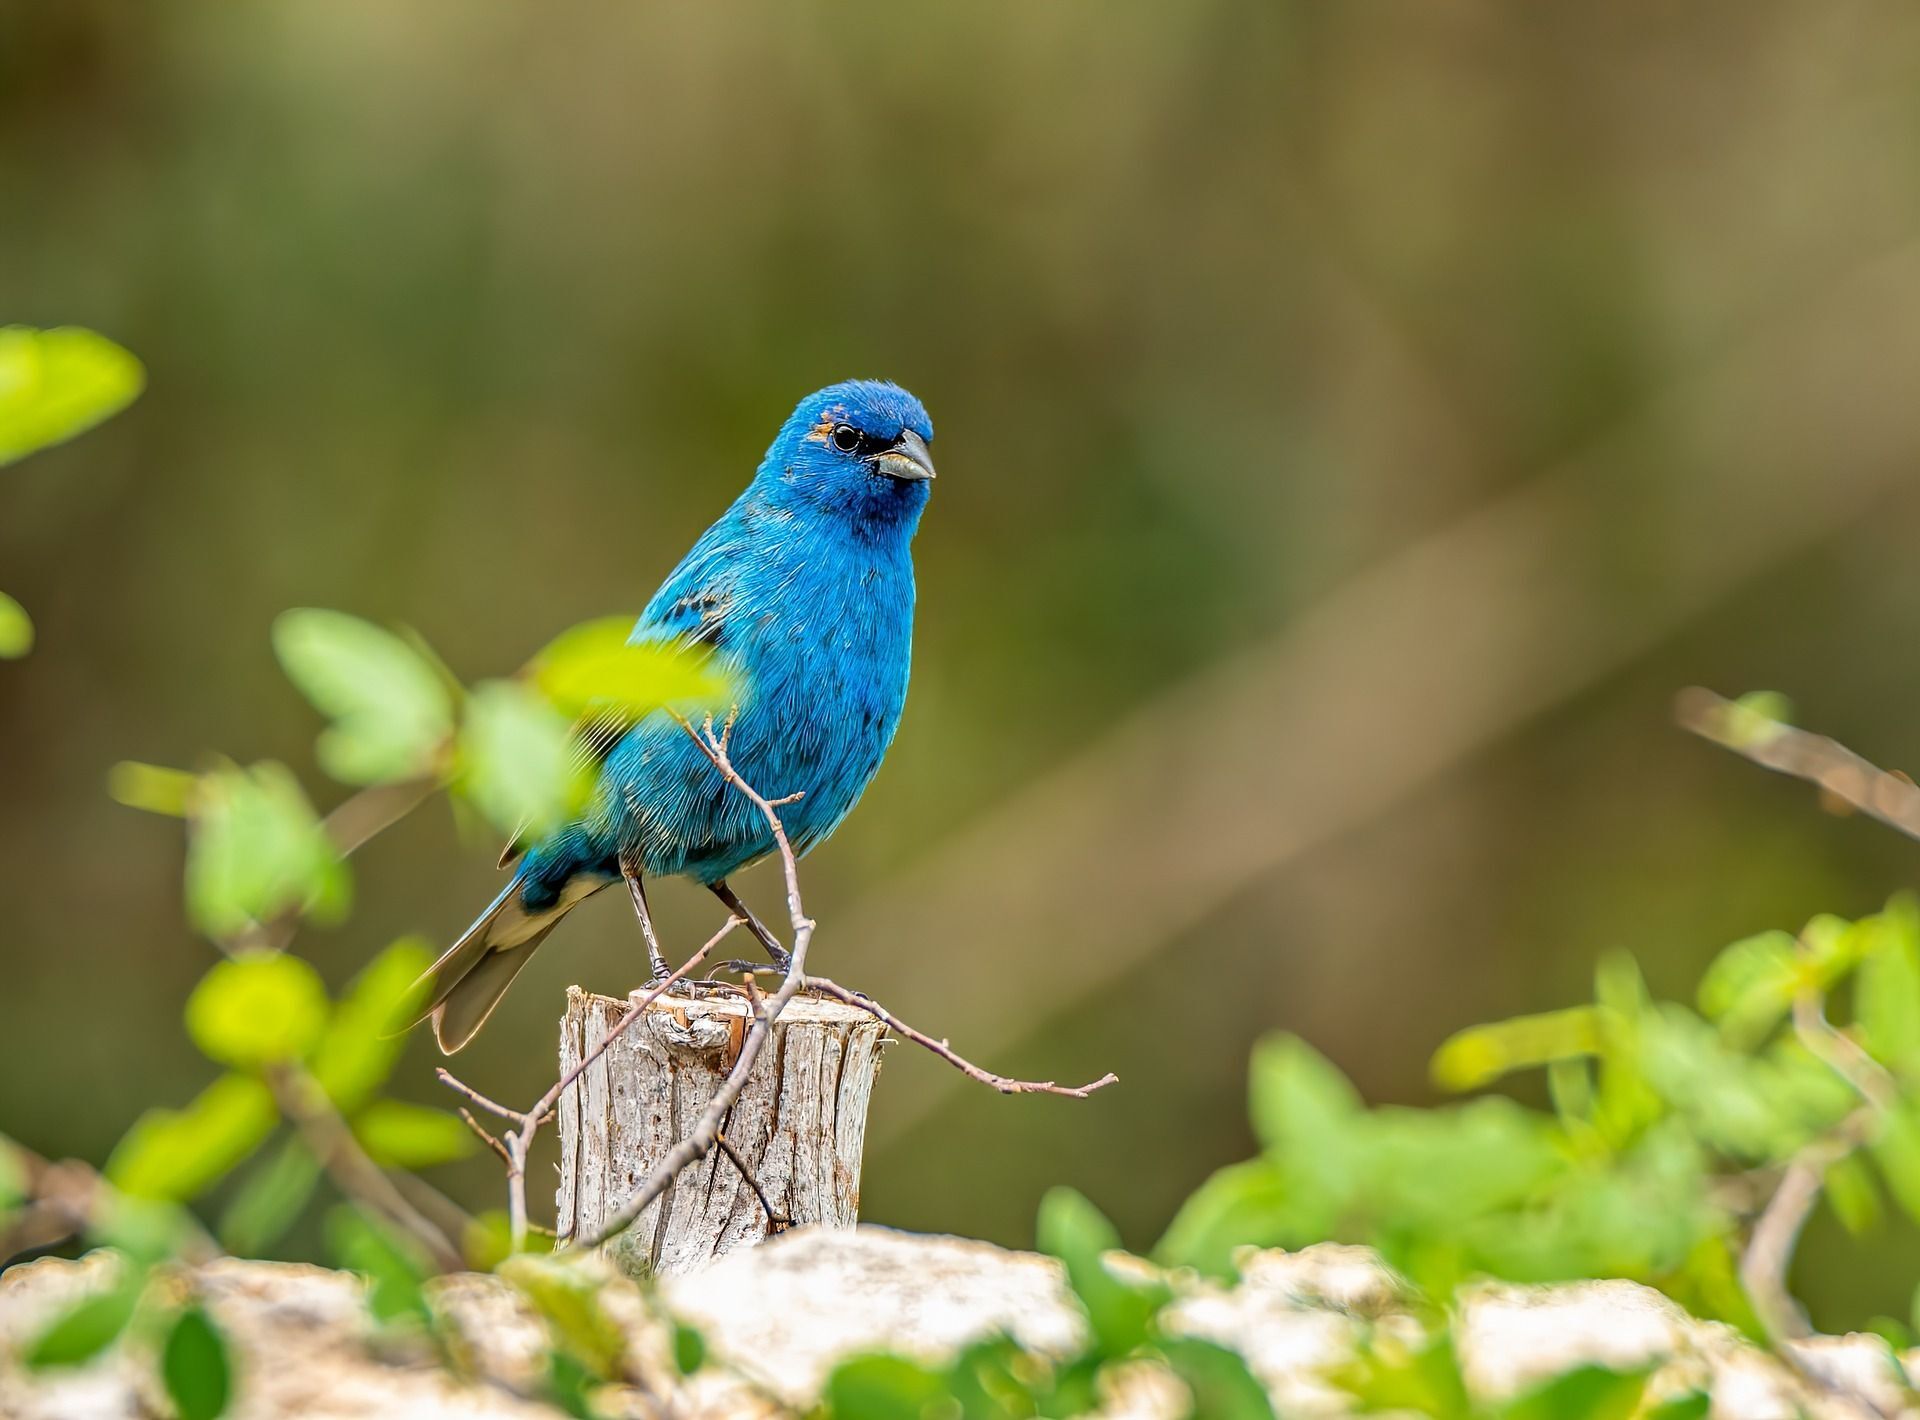
To illustrate the power of this technique, let’s consider the example of the Indigo Bunting (Passerina cyanea), a vibrant blue bird found across many of our wildlife refuges.
-
Indigo Bunting
-
When summarizing the proportion of the top 5 habitat types found within count circles in which this species was detected, we see that deciduous, evergreen and mixed forests along with grassland/herbaceous and pasture/hay dominated in terms of prevalence. The machine learning technique described above then determined that, when looking across all count circles (those that had Indigo Buntings and those that did not), pasture/hay, grassland/herbaceous, forested wetland and mixed and evergreen forests were the habitats most important for predicting Indigo Bunting presence across the landscape. In other words, not only were these habitats present every time Indigo Buntings were detected, but the presence of these habitats was far higher in count circles containing buntings than among all count circles combined. Note that deciduous forest was not even considered important despite the fact that it was the most prevalent habitat type in those count circles containing buntings (Figure 4).
These two pieces of information tell us a great deal about this species and the habitats it associates with across our wildlife refuges. We know that, even in the midst of large swaths of deciduous forest, small patches of grassland or pasture provide nesting habitat for Indigo Buntings. Anyone hiking the trails of Fisherville Brook Wildlife Refuge only to emerge from dense forest into a small grassy clearing and find singing Indigo Buntings can attest to this.
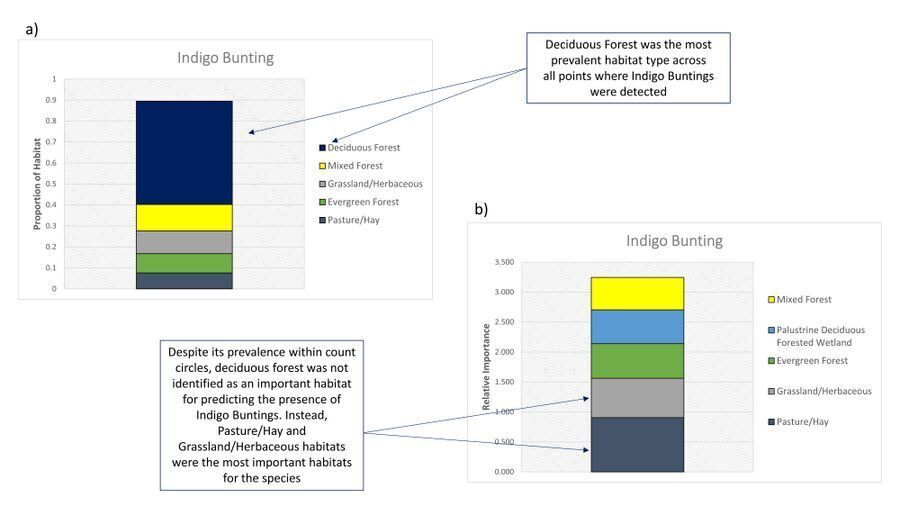
Figure 4: Analysis of point count data and the use of statistical machine learning techniques have provided a wealth of information about bird-habitat associations on our wildlife refuges. Here is an example for the Indigo Bunting (Passerina cyanea). In a) we can see that deciduous forest is the most prevalent habitat type associated with point count circles where the species was detected, while b) a more detailed analysis using an ensemble learning modeling technique elucidates that despite this being the most common habitat, pasture/hay and grassland/herbaceous habitats are much more important at predicting the presence of Indigo Buntings.
—
We can drill down even further into the data to determine the level of importance each of these habitats have for a given species. When the relative importance of each habitat is plotted, we see that pasture/hay is not only the most important habitat type in predicting the presence of Indigo Buntings, but it is of far greater importance than even the next most important habitat type, grassland/herbaceous. This arms us with the knowledge that, to promote growth of our bunting population, we should focus efforts on the creation or preservation of pasture habitat above all others (Figure 5).
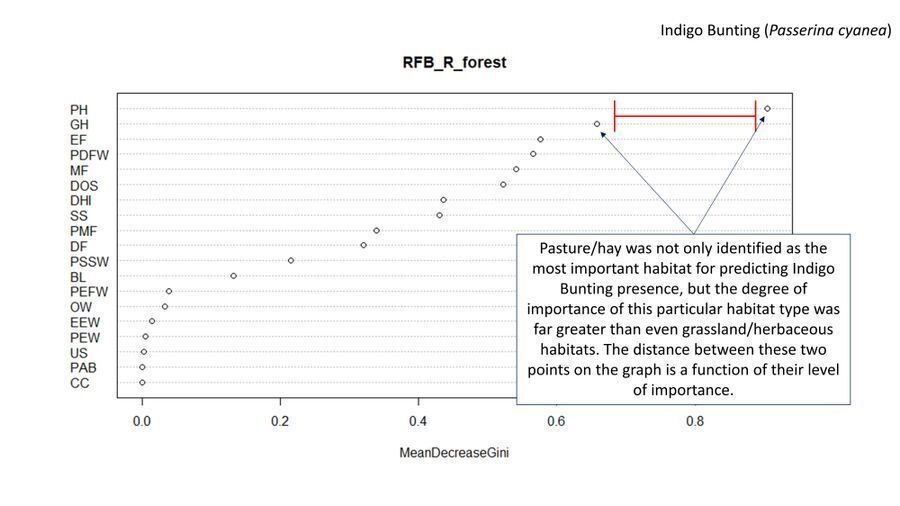
Figure 5: A plot of each habitat type and its relative importance at predicting the presence of Indigo Buntings (Passerina cyanea) demonstrates the importance of pasture/hay (PH) habitats relative to all others. The X-axis represents the mean decrease in importance of each habitat type (MeanDecreaseGini) while the y-axis displays all habitats present across all count circles. The red line shows the drop in importance from pasture/hay to grassland/herbaceous habitats. (PH = pasture/hay, GH = grassland/herbaceous, EF = evergreen forest, PDFW = palustrine deciduous forested wetland, MF = mixed forest, DOS = developed open space, DHI = developed high intensity, SS = scrub/shrub, PMF = palustrine mixed forest, DF = deciduous forest, PSSW = palustrine scrub/shrub wetland, BL = bare land, PEFW = palustrine evergreen forested wetland, OW = open water, EEW = estuarine emergent wetland, PEW = palustrine emergent wetland, US = unconsolidated shore, PAB = palustrine aquatic bed, CC = cultivated crops.)
—
As data analysis continues, we will have this level of detailed information for all species found on our refuges. A comprehensive report on the state of our birds will be released in the new year that will enable Audubon to move forward with conservation and management plans that are well-informed and data-driven.
Literature Cited:
Haggerty, T. M. and E. S. Morton (2020). Carolina Wren (Thryothorus ludovicianus), version 1.0. In Birds of the World (A. F. Poole, Editor). Cornell Lab of Ornithology, Ithaca, NY, USA. https://doi.org/10.2173/bow.carwre.01